
Updated December 3, 2025
As battery production lines scale and cycle times shrink, manufacturers increasingly depend on real-time tracking of battery quality in manufacturing. Such capabilities allow them to catch defects early, reduce scrap, and maintain consistent output. Modern cell and pack manufacturing generate vast amounts of metrology, formation, electrical, and environmental data. Without a unified way to collect and interpret this information, critical defects may remain hidden until much later—when rework is expensive, slow, or impossible.
Real-time visibility provides manufacturers with the situational awareness needed to make fast, data-driven decisions. By connecting measurements to each individual cell or module and threading that information across every station, teams can identify which batteries fall out of spec immediately rather than waiting for downstream testing or failed field performance.
Why Real-Time Tracking Matters for Battery Quality
Battery manufacturing is highly sensitive to variations in materials, equipment stability, operator decisions, and environmental conditions. Even small deviations—such as a slight inconsistency in electrode coating or an out-of-range formation step—can create performance issues later.
Real-time tracking addresses several challenges:
-
Early detection of out-of-spec conditions before they propagate into downstream stages
-
Reduced scrap and rework, since issues are caught at the source
-
Improved yield, as problematic batches can be isolated
-
Stronger traceability, which supports customer audits and upcoming regulatory requirements
-
Higher confidence in end-of-line quality metrics
Manufacturers that rely solely on manual inspection or end-of-line analysis inevitably miss opportunities to intervene earlier.
How Digital Threading Enables Real-Time Tracking of Battery Quality
In real-time tracking in battery manufacturing, the creation of a digital “manufacturing traveler” stays with each battery from raw materials through final assembly. This digital thread consolidates the full bill of materials, the machine and process parameters recorded at every station. This includes environmental measurements such as temperature, humidity, and pressure, and all test and formation results. It also includes operator inputs and any exception notes that arise along the way. Because every data point is tied to a unique cell or module ID, quality status can be assessed instantly. This is true even as the battery continues through upstream stages of production. The digital thread removes the blind spots that traditionally make root-cause analysis difficult, giving teams full visibility into whether materials, recipes, or specific stations are contributing to quality drift.
By linking every data point to a persistent digital identity, the digital thread also enables powerful cross-referencing and retrospective analysis that would be impossible with manual tracking or disconnected systems. Engineers can trace a defect back through the exact sequence of machines, operators, materials, and environmental conditions that touched the battery. Such a capability can reveal root causes that often hide in complex interactions across stations. Over time, the accumulated data forms a rich historical record that can be mined for patterns. This can include recurring issues tied to specific material lots, subtle shifts in equipment performance, or inconsistencies between parallel production lines. This continuous learning loop helps manufacturers refine process controls, tighten quality windows, and drive continuous improvement across the plant. In effect, the digital thread becomes the backbone of a closed-loop quality system, where every production run strengthens the next.
Using Real-Time Dashboards and Alerts to Identify Out-of-Spec Batteries
Real-time dashboards give engineers and operators a continuous view of the parameters that define product quality across the manufacturing line. When thickness, moisture, resistance, weight, voltage, impedance, or any other monitored value begins to fall outside the acceptable range, the system can immediately flag the affected battery. This will in turn trigger alerts for quality or maintenance teams, and even pause or adjust equipment if needed. Out-of-spec units can be automatically routed into inspection or rework queues. Trend analysis highlights early signs of equipment degradation or operator error. These dashboards reduce reliance on paper travelers, manual data entry, and offline spreadsheets—tools that often delay decision-making and introduce inconsistencies—while providing a more reliable and responsive foundation for quality control.
Below are some examples of run charts generated by Manufacturing Insights, which illustrate some of the impacts they had on the manufacturing process.
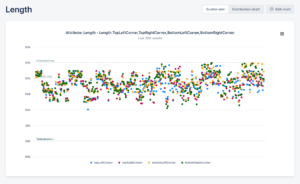
As part of the Manufacturing Insights module, this chart allows line operators and supervisors to plot the length of batteries coming off the assembly line.
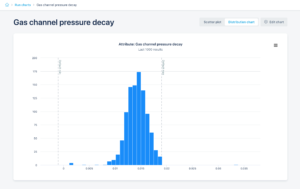
This distribution chart allows line operators and supervisors to analyze pressure decay test results in another view. The chart should appear as a bell curve, allowing outliers to be identified easily, and indicating where further drill-down is required.
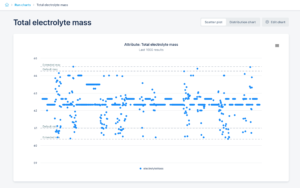
This chart indicates that the electrolyte fill nozzle needed some calibration where fill mass is wavering, which is expected to be an almost straight line after fixing it.
Applying Analytics and SPC to Improve Decision-Making
Statistical Process Control (SPC) and machine learning models strengthen real-time tracking by uncovering subtle patterns that operators might not immediately recognize. These tools can reveal drift across multiple shifts, and correlations between specific material batches and defect rates. They can also show early signs of equipment instability, and variations in performance between production lines or recipes. When applied within a digital thread, SPC provides advance notice that a particular asset, process, or recipe is trending out of control—often before scrap begins to rise. Predictive analytics add another layer of intelligence by identifying which batteries are more likely to fail formation or end-of-line testing. This enables earlier intervention and smoother throughput across the manufacturing line.
Beyond pattern recognition, analytics and SPC also support more advanced diagnostics and prescriptive recommendations. By continuously comparing live data against historical baselines, golden-batch profiles, and machine capabilities, these systems can pinpoint the exact moment a process begins to deviate. This is true even if the deviation falls within traditional control limits. Multivariate models can distinguish between normal interactions among parameters and combinations that signal true quality risk. For example, they can show when ambient temperature shifts interact with specific material lots or machine settings. Over time, these insights help refine process windows, tighten quality thresholds, and guide maintenance or calibration schedules. The manufacturing line becomes more stable, predictable, and efficient with each production cycle.
Scaling Real-Time Tracking Across Multiple Production Lines
As factories grow and introduce new processes or equipment, the ability to scale real-time tracking becomes increasingly important. Unified data models, cloud-based analytics, and standardized pipeline formats allow integration of new production lines quickly while preserving consistent definitions of quality across sites. These shared frameworks ensure that engineering, operations, and quality teams all have access to the same insights. They also simplify the training of new operators through standardized dashboards. The result is a reduction in operational complexity and more reliable benchmarking between facilities.
The Impact of Real-Time Quality Tracking on Costs and Yield
The adoption of real-time quality tracking delivers significant operational benefits. Manufacturers experience lower scrap rates because defects are detected and addressed immediately. Yields improve as teams make proactive adjustments to processes rather than reacting after problems have fully developed. Earlier detection also reduces unexpected failures during formation or customer testing, improving overall resource utilization and removing bottlenecks. With every unit tied to a complete digital history, warranty exposure declines and compliance becomes easier to demonstrate. In a market that demands rapid scaling while minimizing risk, real-time insight has become a critical differentiator rather than a luxury.
Frequently Asked Questions (FAQ)
How does real-time tracking differ from end-of-line quality testing?
End-of-line tests only catch issues after production is complete, while real-time tracking identifies deviations immediately, reducing scrap and improving throughput.
What types of data support real-time quality tracking?
Key data includes metrology measurements, environmental conditions, formation results, equipment telemetry, and materials information linked to each individual battery.
Can real-time tracking reduce production cost?
Yes. By catching defects earlier, manufacturers avoid rework, material waste, and equipment downtime, significantly reducing operational cost.
Does real-time tracking require specialized hardware?
Most manufacturers already generate the necessary data. The critical component is the software platform that ingests, unifies, and analyzes the data in real time.
How does real-time tracking support regulatory compliance?
It creates a verifiable digital history for every battery, helping companies satisfy audits, meet customer quality requirements, and prepare for battery passport mandates.