
In this issue of Battery Smarts, we look at how data pipelines are used to improve product quality, by discovering anomalies during the manufacturing process.
In the last issue of Battery Smarts, we took a look how data pipelines consist of three core elements: Origins, processors and destinations. An origin is a data source. Processors (and executors) are used to transform data. A destination is a location for storing transformed data, perhaps for further processing. A common type of data pipeline is “Extract, Transform, Load,” or ETL, which transforms ERP (Enterprise Resource Planning) data to match an expected schema prior to loading it into a data warehouse system.

For this month’s topic, let’s look at how machine learning-enabled data pipelines are used to find manufacturing anomalies, thus improving overall quality and reducing cost. When talking about anomaly detection, emphasis is usually placed on the results of the data analysis. But it’s also important to consider the extent to which your data plays a role in the success or failure of your anomaly detection efforts.
The first thing to consider is where the source data originates from.
The most optimized production line is fully automated, with raw materials turned into a finished product without any human intervention. In this case, source data originates from the equipment used to create the final product. Data agents installed locally pull data directly from Programmable Logic Controllers (PLCs) used to control the actions of the individual machines, generating data that is naturally structured, less prone to errors and less likely to impact the speed of the assembly process. This setup is also relatively future-proof, in that the number of data points pulled via the PLCs can be increased as the control software improves. To protect against failures such as data loss in the case of a power outage, data agents may store the data locally. A pipeline can then be configured to read the local data store rather than the live data stream.
For manufacturing lines where some parts of the process are performed by skilled manual labor, a human operator may read data and enter it directly into a digital manufacturing traveler. Depending on the amount of automation, most of the digital manufacturing traveler may already be automatically updated, and the operator only needs to verify that a step has been successfully completed and provide their sign-off. In other cases, some parts of the digital manufacturing traveler are updated by a PLC, with the remainder requiring manual input by the operator. Entered values are validated against allowed ranges defined in a Quality Control (QC) process. The digital manufacturing traveler alerts the operator when a QC test fails, so that the product can be pulled off the production line for rework or scrapping.
Due to the possibility of human error during data entry, data pipelines need to include routines that are able to parse and validate operator-entered data. Depending on the result of the data validation step, the pipeline can try to automatically resolve any data entry errors. Otherwise it can flag data errors so that they are resolved offline at a later time.
Another source of data includes third-party sensors installed in existing equipment. For example, one step of a manufacturing process may cut steel plates to specific dimensions. Over time, the accuracy of the cutting machine can degrade, requiring either a re-calibration exercise or the replacement of worn parts to bring the machine back into specification. As the accuracy of the cutting machine diminishes, the cut plates may no longer meet the tolerances required by downstream stages of the manufacturing process. To help identify incorrectly cut plates, additional sensors can be installed in the cutting machine, to accurately measure each plate as it is being cut.
These additional sensors serve two purposes. First, cut plates that are clearly out of specification can be identified and discarded (or in some cases reworked) before they cause issues downstream in the manufacturing process. Second, data originating from the cutting tool’s PLC can be threaded together with data from the third-party sensors to provide greater insights into how the accuracy of the cutting affects the final product. For instance, material costs and rework costs can be reduced if the company finds that product failures are not attributable to steel plates that slightly miss the specifications. Conversely, if the company finds that product failures are tied to steel plates that miss the specifications outside a specific margin, the data indicates precisely where the specification should be updated.
One situation where we frequently see data pipeline efforts fail is when they do not make full use of all the available data types. In the majority of cases, a manufacturing line consists of several different machines used to create the final product. These machines use a mix of the three data types outlined above: PLC, manual entry, and third-party sensors. It’s critical that manufacturing data pipelines are flexible enough to allow the ingest of data in several different forms and from a variety of origins, with the ability to thread data coming from the same source. In the plate cutting example above, additional sensors are used when cutting steel plates to measure the accuracy of the cut. In another context, such as where filling machines experience nozzle wear, additional sensors can be installed at the nozzles to accurately measure flow rates. If the data from the additional sensors isn’t threaded to the PLC data, then a company is not making full use of the available data, which can lead to increased costs for time and materials.
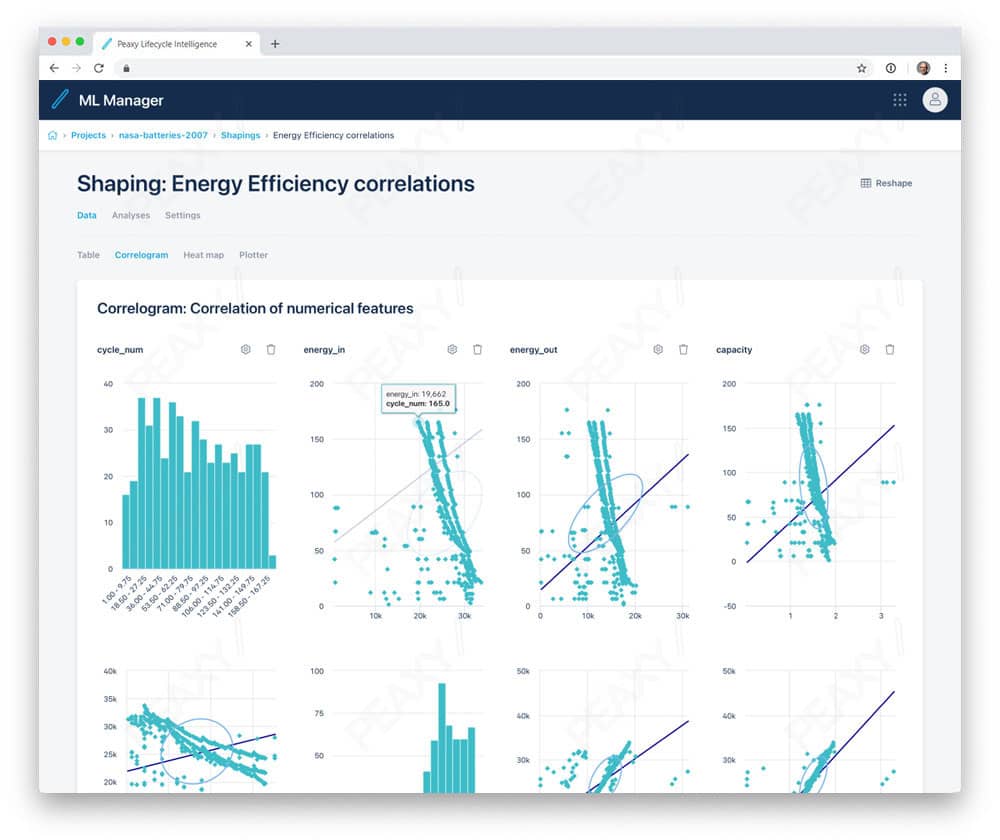
Threading and making use of all available data types can reveal statistical correlations in the data to seed machine learning algorithms.
The temptation in any data initiative is to get results based on current known requirements. Ideally, pipelines should also allow for future changes and updates without requiring them to be recreated from scratch, as happens all too often. For example, over time the number of stages that require a human operator can be reduced, as automated equipment comes online.
A second consideration is data transformation:
Data transformation takes many forms, including data validation and verification. Two key data transformations that shouldn’t be overlooked are data parametrization and data normalization.
- Data parametrization provides a semantic context to data, for example by mapping each attribute in the source data to a valid identifier or human readable name. Data originating from a PLC may use a naming convention based on software registers which are not easily understood. During the data transformation stage, all register names should be mapped to human-readable names.
- Data normalization ensures that attributes used to store similar types of data can be analyzed against one another without the need for further modifications. This is particularly important when production line equipment is manufactured by different vendors. A key attribute in a production line may be temperature, for example. Data normalization would ensure all temperature values use the same unit of measure such as degrees Celsius.
After transformation, data can feed directly into machine learning algorithms:
To prepare for the machine learning (ML) phase, the transformed data is passed through an ML anomaly detection algorithm, such as logistic regression. In this scenario, a model was previously trained using a comprehensive representation of the historical data originating from both the production line and field-deployed assets. The production line data provides the model with the as-built data, while the field-generated data provides the in-use data. The model is then used to identify products more likely to suffer from early failures. For example, products deployed in hot-humid climates or cold-arid climates may fail more often when a specific piece of equipment is slightly out of calibration or when using source material from one vendor or another.
Another scenario for the transformed data is to load it into a relational database. After the data is stored in the database, it can be analyzed using analytics software to identify possible build issues, manufacturing insights and KPIs (Key Performance Indicators). Using a single database for storing both field data and manufactured data allows data queries to be created effortlessly in either direction. A company may experience several unexplained product failures. By querying the database for the failing serial numbers, operators can look for commonalities across the failing products. Once a failing component is identified, a second query can be used to identify all in-field deployments (and any products still in stock) and either recall or rework the product. On the other hand, the analysis may prove that the failures had nothing in common and that the installed base is not at risk. In either case, your critical business decisions are driven directly by the data.
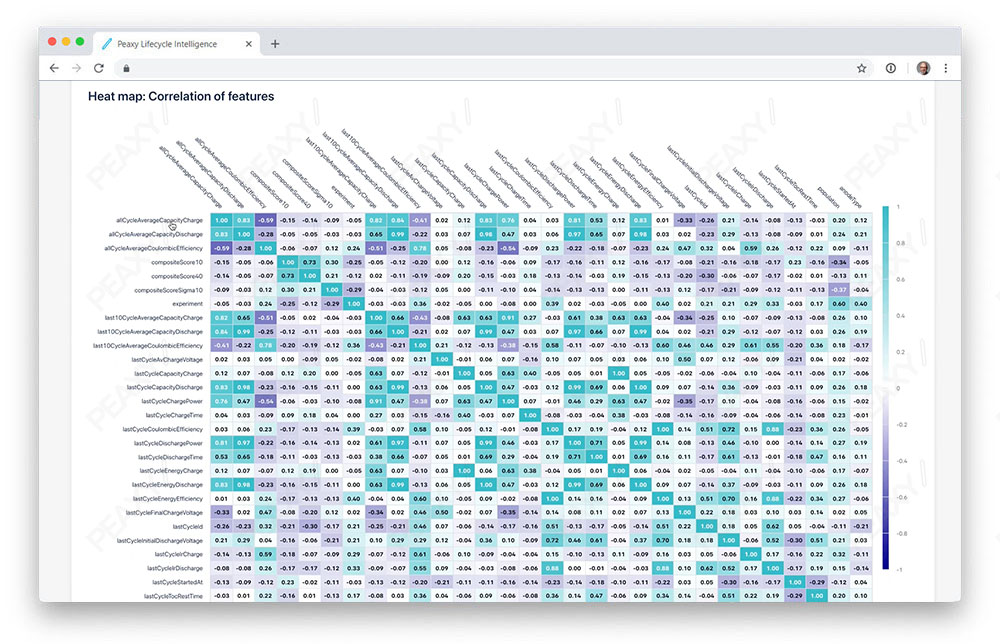
Tools such as heatmap visualizations can show correlations between all features of a dataset.
Peaxy Lifecycle Intelligence trains a basket of machine-learning algorithms on historical failure data to discover non-trivial discrepancies in live data streams that can signal incipient component failures. These anomalies are fed into PLI’s alert management system, where the user can fully analyze the data on a proactive basis.
By choosing to pre-emptively repair or replace equipment, operators can avert catastrophic failures. Because each asset class has a unique use case, Peaxy’s analytics experts perform the initial tuning and tweaking of the algorithms. The module’s accuracy improves over time through continuous data ingestion, the use of multiple competing algorithms, and manual feedback on false positive alerts.