
What does data parameterization mean?
Data parameterization means taking a large amount of data and generating a much smaller data set, thereby making it more easily digestible. A data set might be, for example, last year’s worth of OPC tags at 1 Hz from a power conversion system that is 200 tags wide (50 GB at double precision!). We often call these derived parameters “composite scores,” and they usually have values between 0-100. Their purpose is to characterize attributes such as overall performance, health, economic output vs. expected, or remaining useful life to name a few examples.
Several of these composite scores are typically generated from any single data parameterization exercise. In the PCS case, these could be scores which characterize the health of the inverter, the total lossed in the step up transformer and so on.
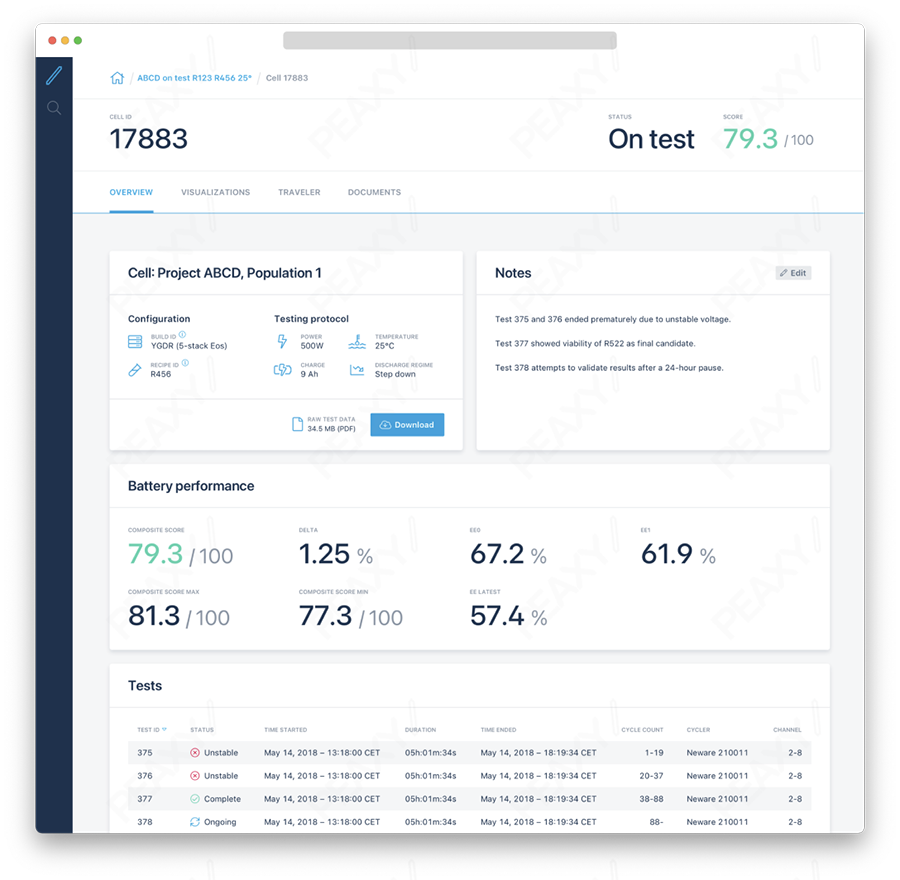
Data parameterization provides composite scores that allow you to tell at a glance whether battery designs are performant, or how yields can be improved.
Data scientists might call this feature extraction, which is close to the concept, but not exactly what we mean here because it’s really at a lower level. For instance, taking an SEM image of a Si/C colloid we are using to make a next gen lithium-ion anode, we might use “imageJ” to generate moments of the size distribution of that colloid. The average size, the variance of the size and so on would be the result of a feature extraction exercise. Of course we do that also, but when we speak of data parameterization, our approach is at a higher level than this.
You could argue that what I’ve described as data parameterization is just another way of saying KPIs. There is some truth to this, but the amount of data we use and the techniques we use to parameterize are generally a bit more sophisticated than your typical KPI. A KPI for a battery system might be total discharge energy over the battery’s life, or average round trip efficiency (RTE) for the last year. While this is also part of our data parameterization process, we go a step further and use these values, with other pieces of information, to generate composite scores.
What can you do with automated data parameterization?
Of course this depends on the context. We have been fortunate enough to have worked with multiple organizations and their battery data challenges, and there are some common patterns.
In R&D, we’ve seen some tendencies to be initially resistant to too much automated data parameterization for fear of being prevented from doing all of the desired analyses. Just because you parameterize your data one way, however, doesn’t mean the data goes away and can’t be used for a parallel analysis. It’s a similar issue in manufacturing where there is often a question of whether data parameterization adds value above and beyond what the MES system provides.
In both of these scenarios, parameterization plays an important role in providing metrics that show how the physical asset is performing in an easily digestible way. For R&D, data parameterization allows product developers to quickly see which battery designs are performant. For manufacturing engineers, it allows them to quickly see how yields could be improved, among other things.
How does data parameterization positively impact R&D?
Let’s talk a bit more about the R&D example. As a rule, battery manufacturers do large amounts of battery cycling. We’ve talked about how we normalize all of this cycling data in past issues of the newsletter, but I’ll tell a brief story about a customer we’ll call Acme Industries.
Acme had over 1,000 channels of cyclers generating data at any time. The R&D team wanted to keep management informed of the latest progress, so they generated a script which would take the latest cycler data, plot it up in I,V vs. time plots (sometimes T) and wrap it into a pdf to distribute every morning, promptly at 6am.
This was quite a bit of work for them to solve the multi-cycler problem, move all of the data to the proper NAS device, and generate the plots and so on. But from what we heard, not many started their morning browsing the (typically) 80-page document.
To address this challenge, we took the time-domain data and converted it to step data, including CC charge, CV charge, discharge, rest, etc. We then took this step data and converted it into cycle data (not as trivial as it sounds) and extracted per cycle features such as RTE, total charge, total discharge, etc. Finally, we took this cycle data and parameterized it, thus generating the composite scores we’ve been discussing.
In practice, a battery might have a low score because it had a low initial efficiency, or perhaps it shorted after 50 cycles (remember this is R&D we’re talking about). Looking at the data in a parameterized format, you can view the DOE results and plot, for instance, the ‘cycles-to-short’ vs electrode formulation and immediately see the performant ones with just a few clicks of the mouse.
Because the data is presented in a point and click interface, you are able to drill down to the lowest level of data available, should you desire. This ends up being much more useful and compelling than reading an 80 page document.
How does data parameterization positively impact manufacturing?
Data parameterization for R&D is philosophically similar to manufacturing processes where a large amount of data is parameterized into a much smaller number of health scores. While you can do the typical things like throughput and yield for steps in a process, parameterization allows you to go much further than typical MES systems. This is because an analytics partner is generally much more familiar with the types of QC data that are involved with the materials which go into a battery manufacturing process, and the batteries which come out.
A typical composite score for battery manufacturing would be health scores along the way. For instance, we would take the QC from anode lots which could be as simple as thickness, or as complex as third-party XPS measurements. We then automatically ingest this information, perform feature extraction, and give the anode lot a health score which relates the incoming QC to an idealized case. Just because our anode roll has a score or 85 out of 100 doesn’t mean we don’t use the roll. But now we have a usable parameter to relate to our end of the line yield for this lot of batteries.
How does software architecture impact the quality of data parameterization?
In a typical enterprise, we’re talking about a lot of different systems with three-letter acronyms, including MRP, ERP, CRM, MES, or PLM. These software tools will take your data and route it to some sort of data storage for later retrieval. There will typically be steps in the background to validate and thread your data, in order to associate the data properly. While most battery analytics software can do this, a key extra feature is a step behind the scenes called “pub/sub,” or Publisher/Subscriber. This is often spoken of in the context of real-time or event driven software.
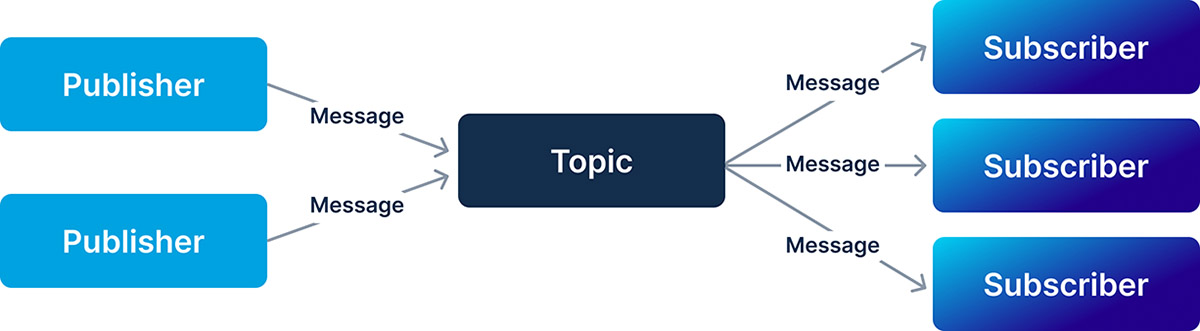
Pub/sub is a software architecture that can enhance the quality of data parameterization. Like a newspaper subscription, the pub/sub software model allows events to be published to more than one subscriber.
Take the manufacturing example above for the anode. Imagine we just made a roll of anode and are characterizing it for use in battery assembly. Maybe we take some XPS measurements, and perhaps we take some half cell measurements as well. This results in data. After this data is ingested, we publish its arrival as an event. There will be several subscribers to this event. These subscribers are really pieces of software which do the parameterization. For example, the half-cell subscriber will take the cycler data, do an analysis, come up with some features and store them. When all of the anode characterization is finished, this is also published and the final data parameterization features kick in. Most of this is happening without anyone consciously realizing, but the final composite health score gives a level of confidence that is just impossible using a manual process where your data is broken up across different systems. We’ve seen time and again that data parameterization, possible only with careful data threading, will have major impacts on product quality and revenue optimization.